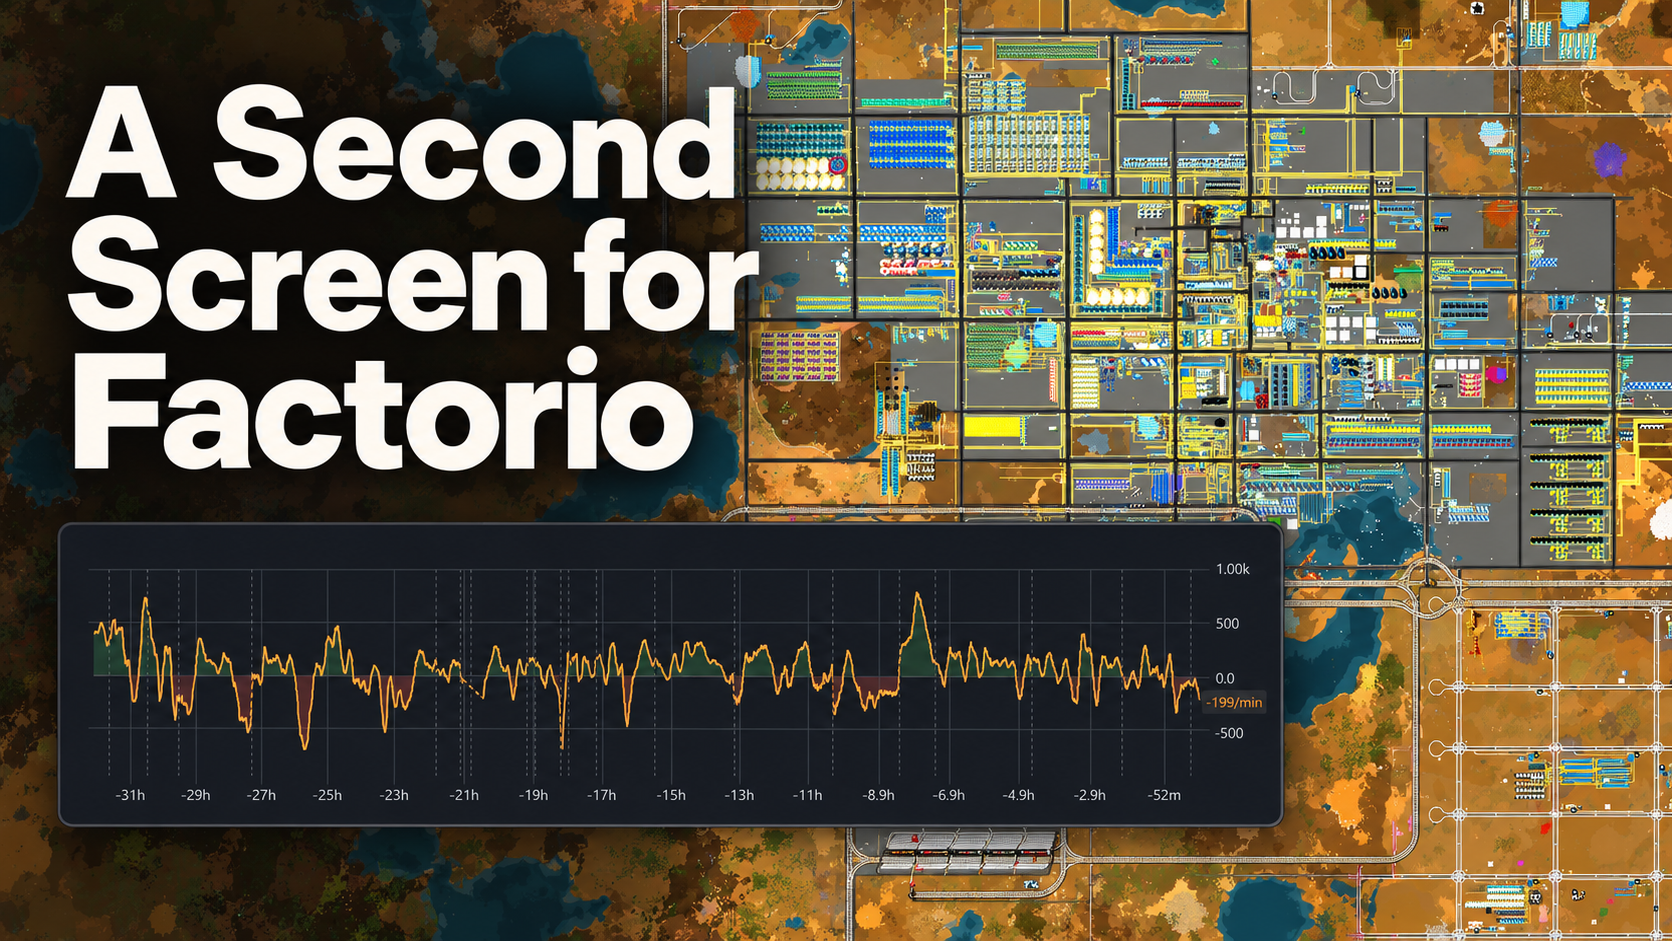
Factorio is a game about building increasingly elaborate infrastructure. I’ve now added some outside the game: a dashboard for watching production, power, and bottlenecks on a second monitor.
I’ve always enjoyed the engineering side of Factorio: scaling and debugging complicated systems. Huge spreadsheets and planning documents feel more like work, so I’ve avoided them. The dashboard aims for that middle spot: clear measurements that help me decide what needs attention next.
I’m more than 2,000 hours into Factorio at this point, with over 250 hours in this save. I’m playing Pyanodons, one of Factorio’s most complicated mod packs.
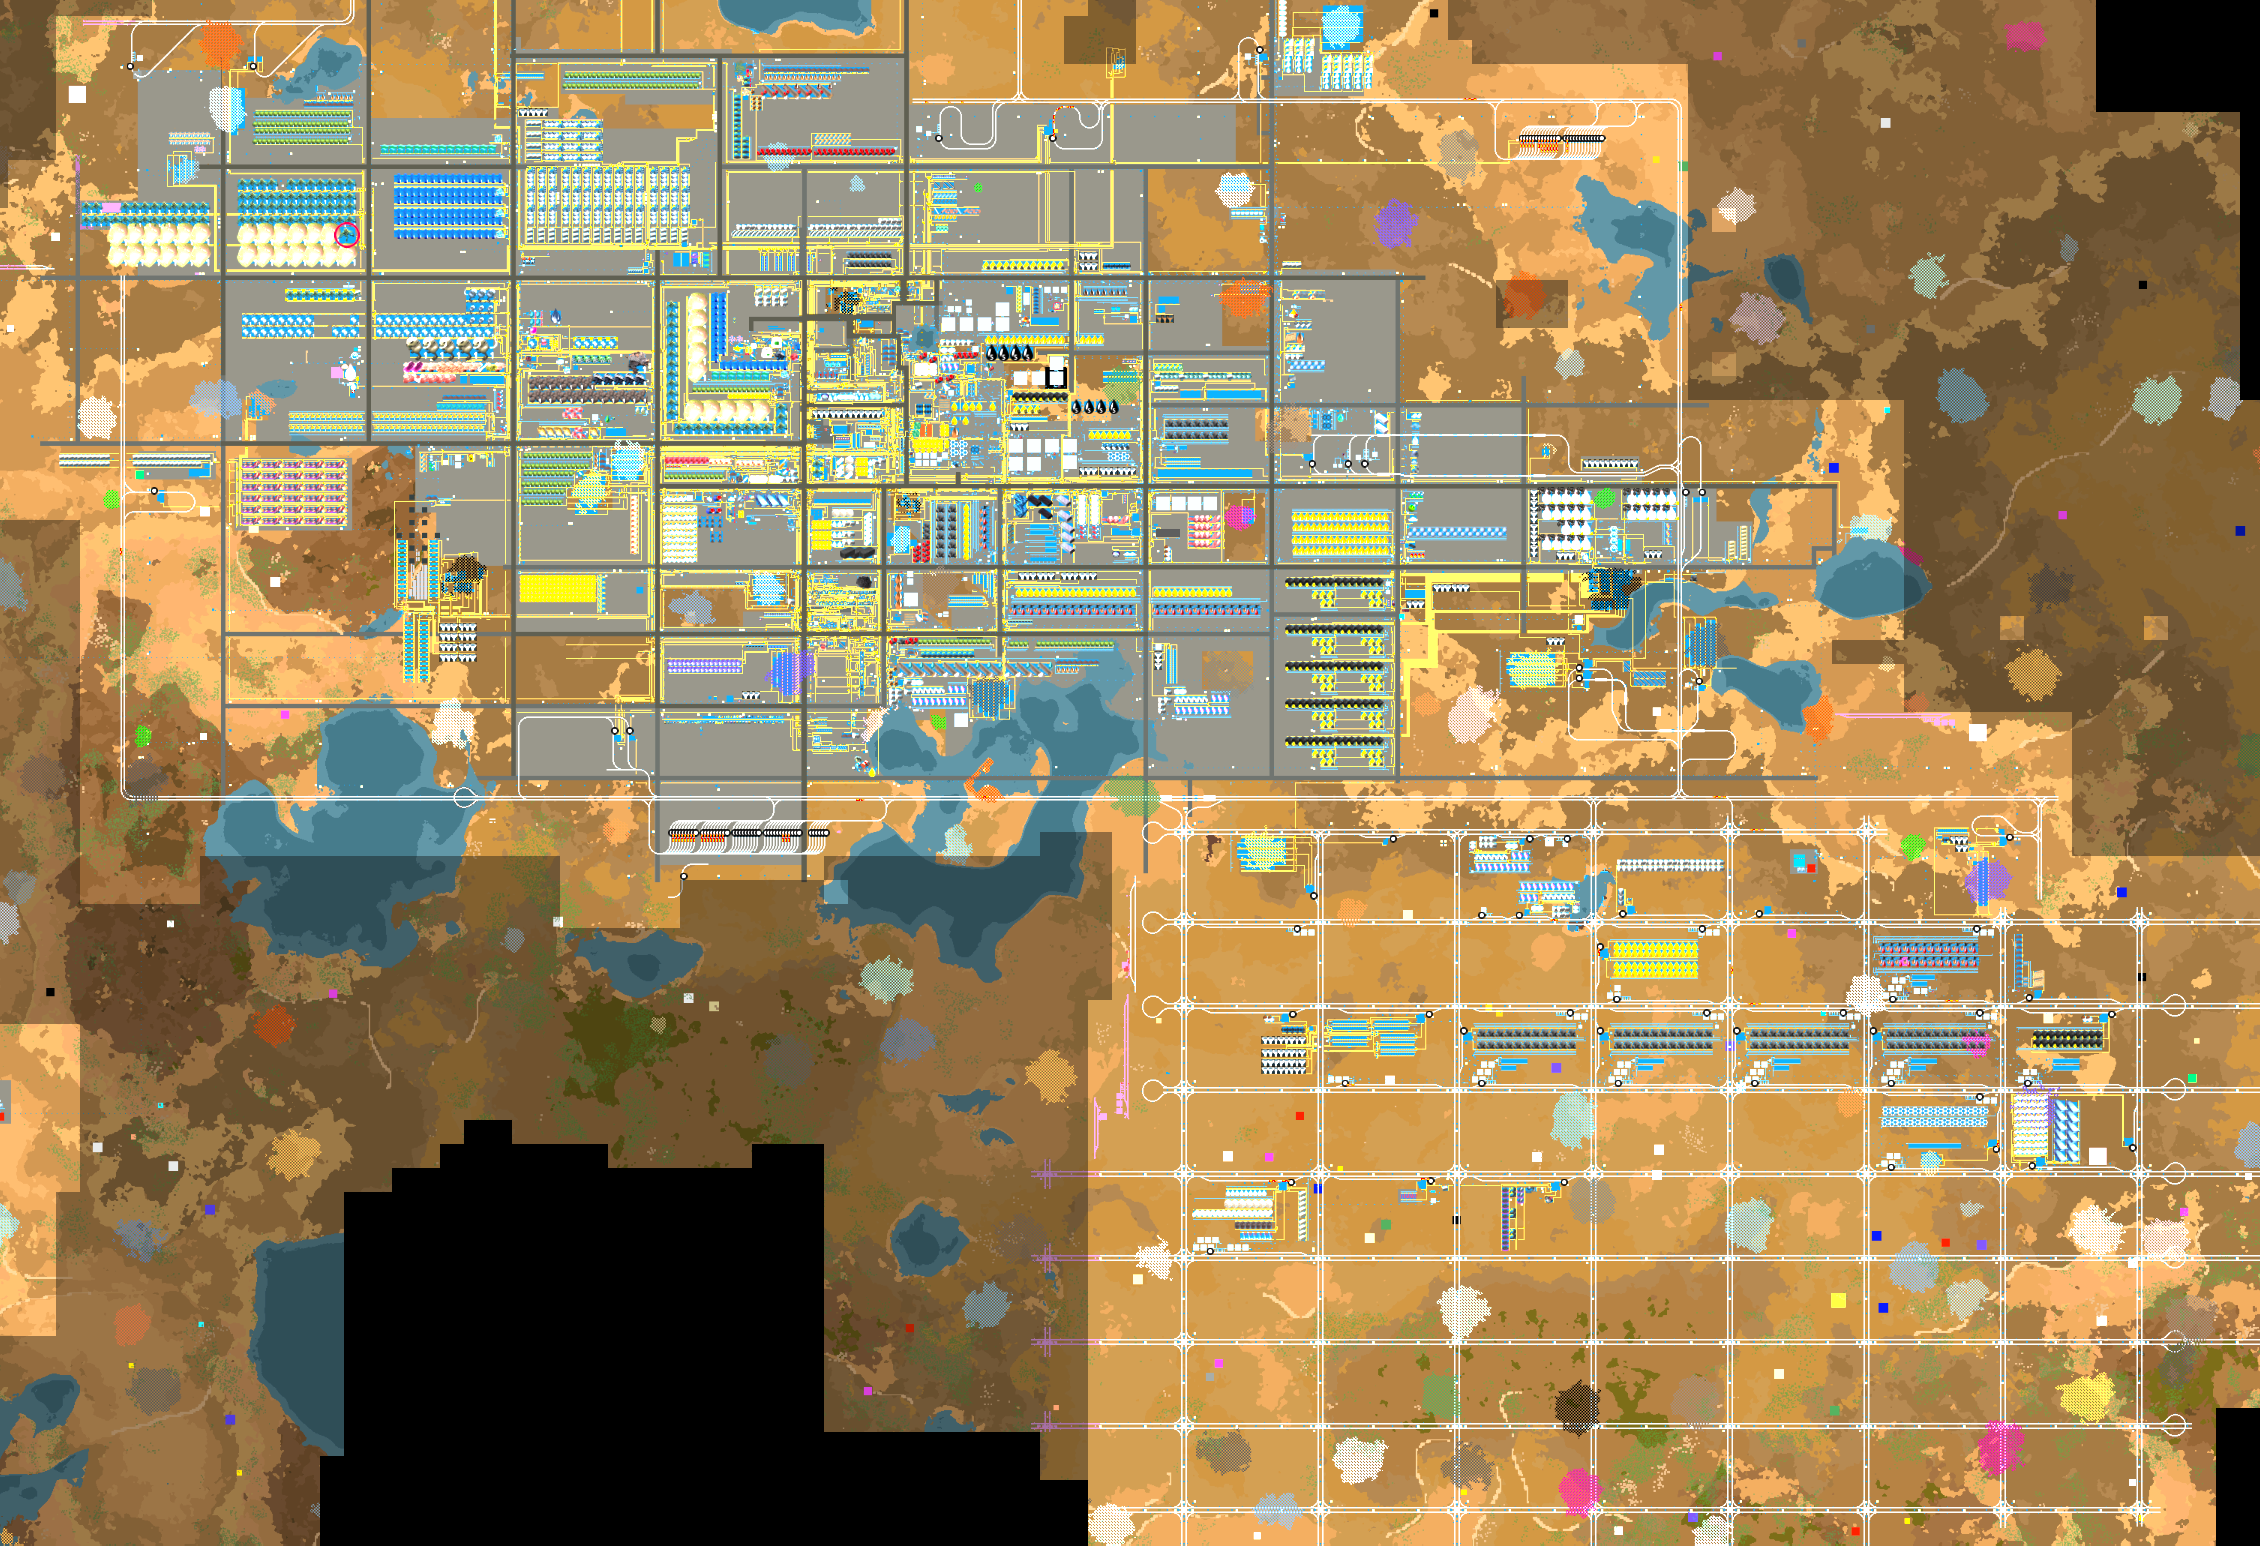
I wanted to go beyond the in-game tools: keep the graphs on a second monitor, dig into net production for both items and fluids, and add more specialized analysis as I need it.
Following an Item Through the Factory
Searching for an item brings its related graphs into view. For iron plate, that includes production, consumption, net production, and whether machines making it are starved or backed up. The search works across the archived data, including items that don’t make the default list of highest production rates.
Those are different questions. Production tells me how much is being made. Net production subtracts consumption, so a negative value means the factory is using something faster than it makes it. Machine status adds another piece: is a machine waiting for an ingredient, or waiting for somewhere to put its output?
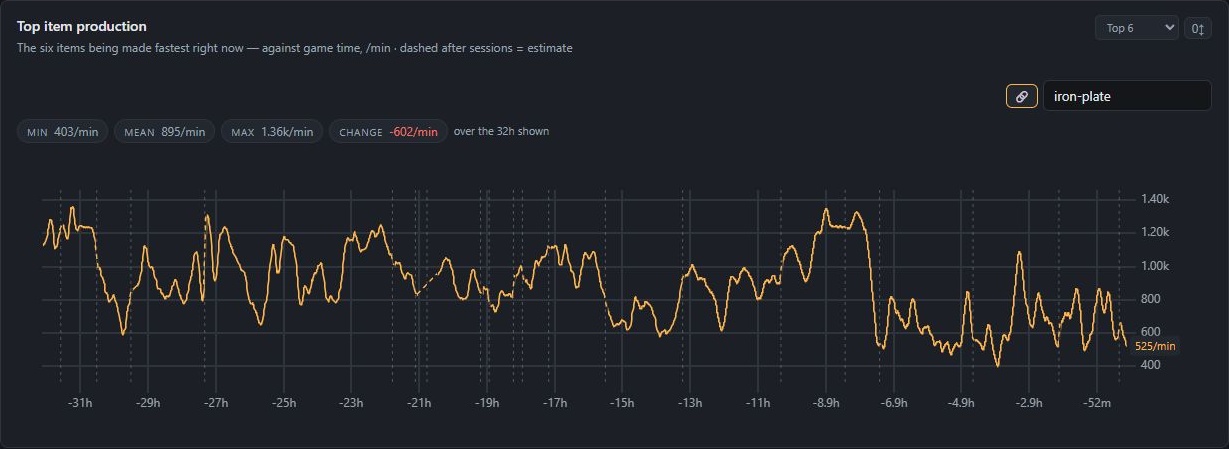
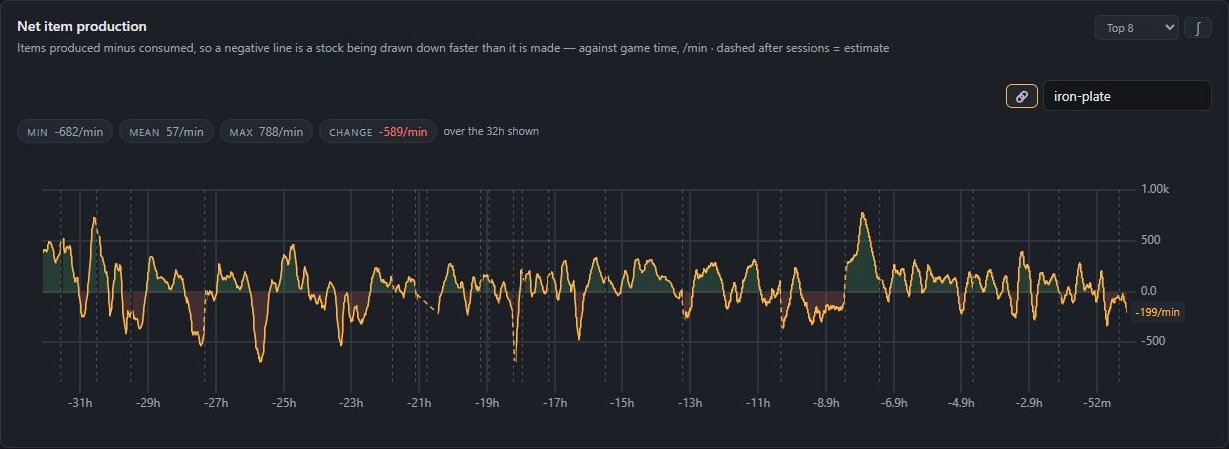
The search also shows possible upstream ingredients. I can follow one of those to its own graphs and keep working backward through the production chain. There can be multiple enabled recipes for an item, so these are possible inputs, rather than a claim about which recipe every machine is actually using.
Getting the Data Out
A custom Python exporter runs Lua queries inside Factorio over RCON and exposes the results to Prometheus. A Flask application archives the measurements in SQLite, keeping the long-term history independent of Prometheus retention.
JavaScript and uPlot handle the interactive charts in the browser. The services run in Docker Compose, and each chart is defined in its own configuration file. Adding another visualization doesn’t mean building another page from scratch.
The Factory’s Timeline
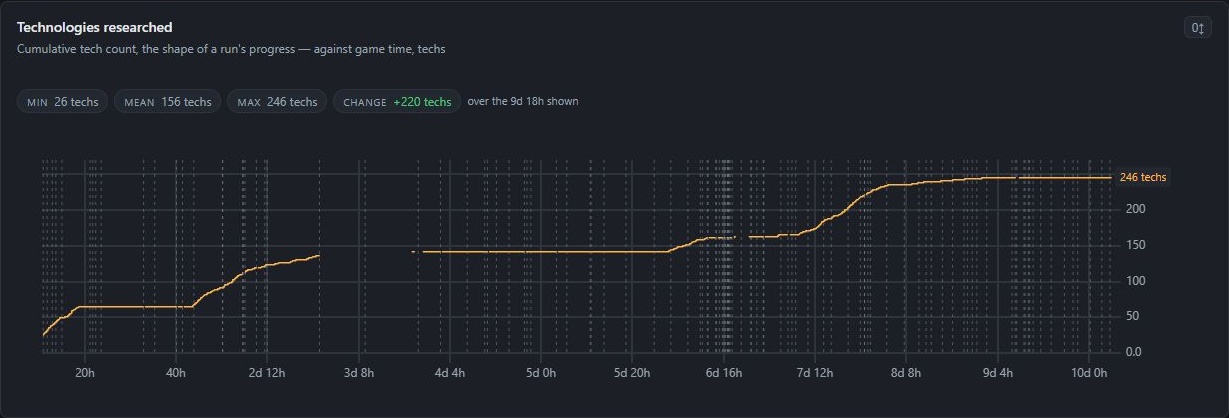
The most interesting challenge was getting the graphs to follow the factory’s timeline. Every chart uses Factorio’s internal tick counter. If two play sessions are separated by days, they still appear as continuous game time.
Loading an older save makes that more complicated. The factory has gone backward, but the dashboard still has measurements from the future I just abandoned. That creates a fork. The dashboard detects it and trims the overlapping history, so conflicting timelines don’t get drawn as one curve.
The time controls range from the last 15 minutes to the full recorded history. I can look closely at a recent change or pull back to see the longer run, with both views using the same game clock.
Making Collection Cheaper
Performance meant looking beyond how much data each query returned. In one measured collection cycle, gathering the statistics took 480 RCON round trips and 56 seconds. Batching statistics across forces and surfaces brought that down to four commands taking around 0.45 seconds.
Background polling keeps chart requests responsive even when the game takes time to answer. Opening a graph doesn’t have to wait for a fresh collection cycle to finish.
There’s also a graph for the monitoring itself: an estimate of how much time the more expensive polls spend inside Factorio. Collecting more data has a cost, so that belongs on the dashboard too.
The goal is simple: make the next problem easier to spot, then get back to building.